Replayed example · Nov 11, 2026, 12:00 PM ET · not current data
AMD AI Chart Analysis: A Real Example, Level by Level
AMD designs processors and graphics chips for PCs, servers and data centres, including accelerators aimed at AI workloads.
Below is one real read of the AMD chart by the DayTrade AI analysis engine: what it saw at 12:00 PM ET on November 11, 2026, the long setup it proposed, and what the price did afterwards.
The read: a long setup at 553.50
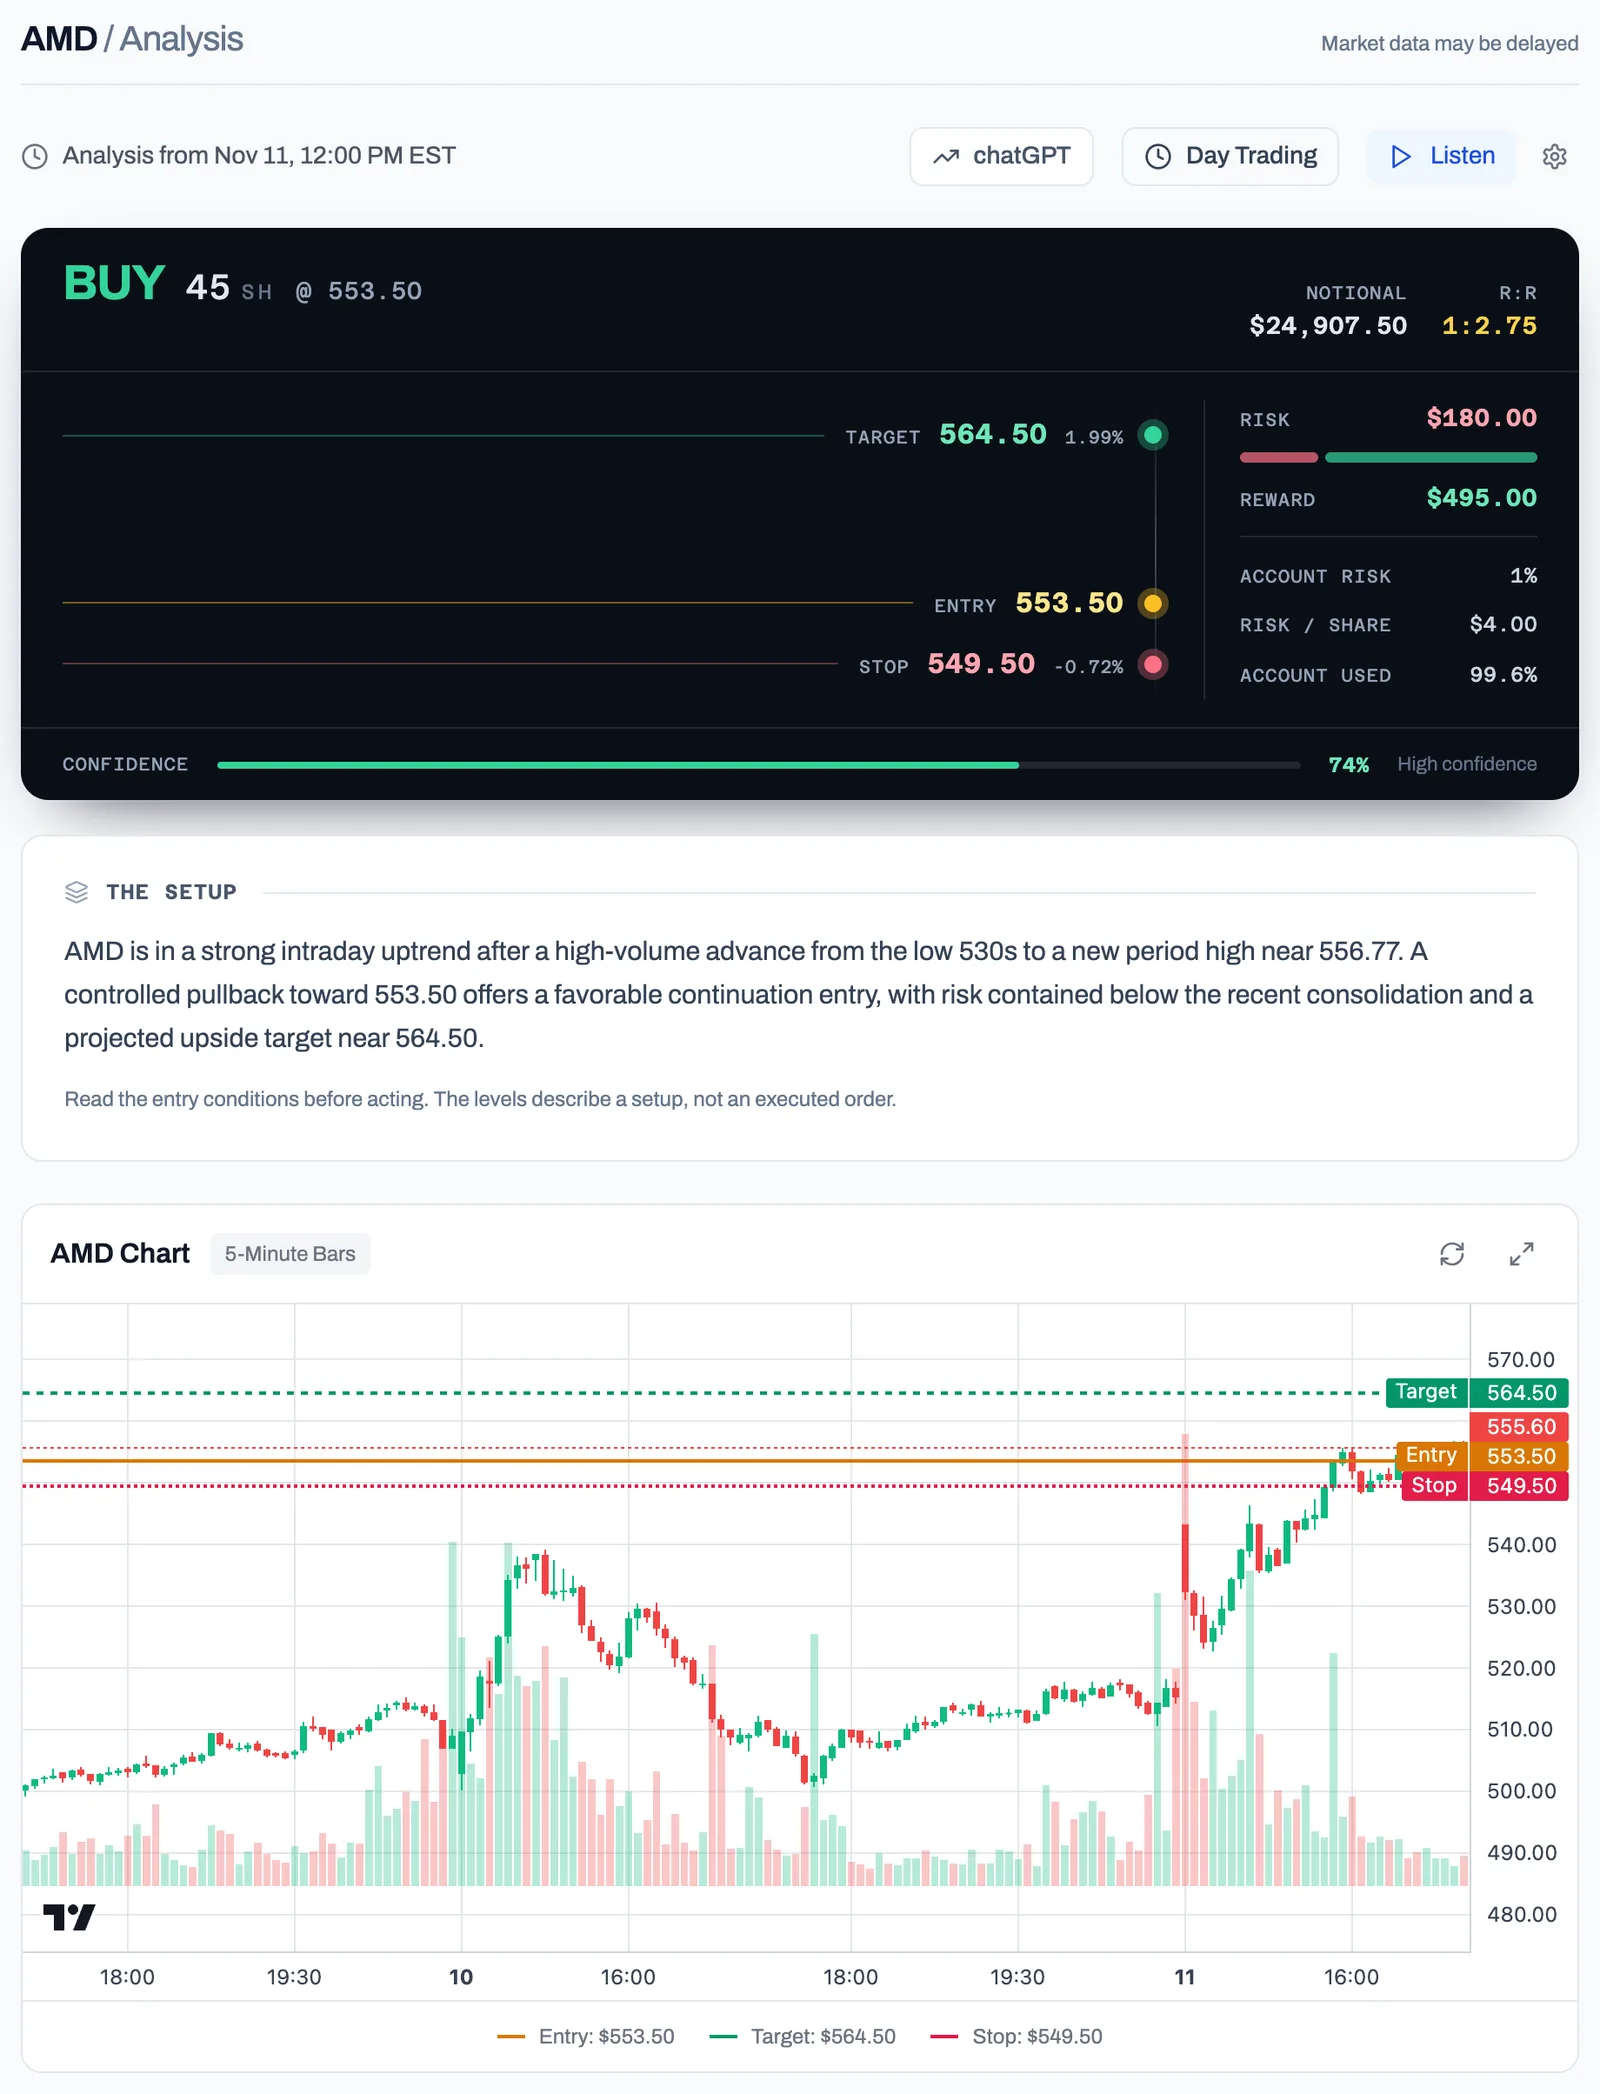
AMD is in a strong intraday uptrend after a high-volume advance from the low 530s to a new period high near 556.77. A controlled pullback toward 553.50 offers a favorable continuation entry, with risk contained below the recent consolidation and a projected upside target near 564.50.
| Direction | Long (buy) |
|---|---|
| Entry | 553.50 |
| Stop | 549.50 (0.72% from entry) |
| Target | 564.50 (1.99% from entry) |
| Reward to risk | 2.75 to 1 |
| Model's stated confidence | 74% |
Why it proposed this
Price has formed higher highs and higher lows, breaking above the 550-554 consolidation zone and holding near the session high. The setup uses a pullback entry below resistance, a stop beneath the recent 548.28-550.26 support area, and a target based on continuation above 556.77. Estimated risk is 4.00 points and reward is 11.00 points, producing a 2.75:1 risk-reward ratio.
Strong higher-timeframe uptrend with elevated intraday volatility following a 14.46% five-day advance. Momentum remains bullish, but price is extended near the period high, so the setup is preferable on a pullback or confirmed break-and-retest rather than by chasing.
Patterns and levels it named
Patterns: Trend Continuation, Resistance Breakout, Bullish Flag, Higher Highs and Higher Lows.
Support
- 550.00strong
- 543.50moderate
- 535.50moderate
Resistance
- 556.77strong
- 560.00moderate
- 564.50moderate
What happened next
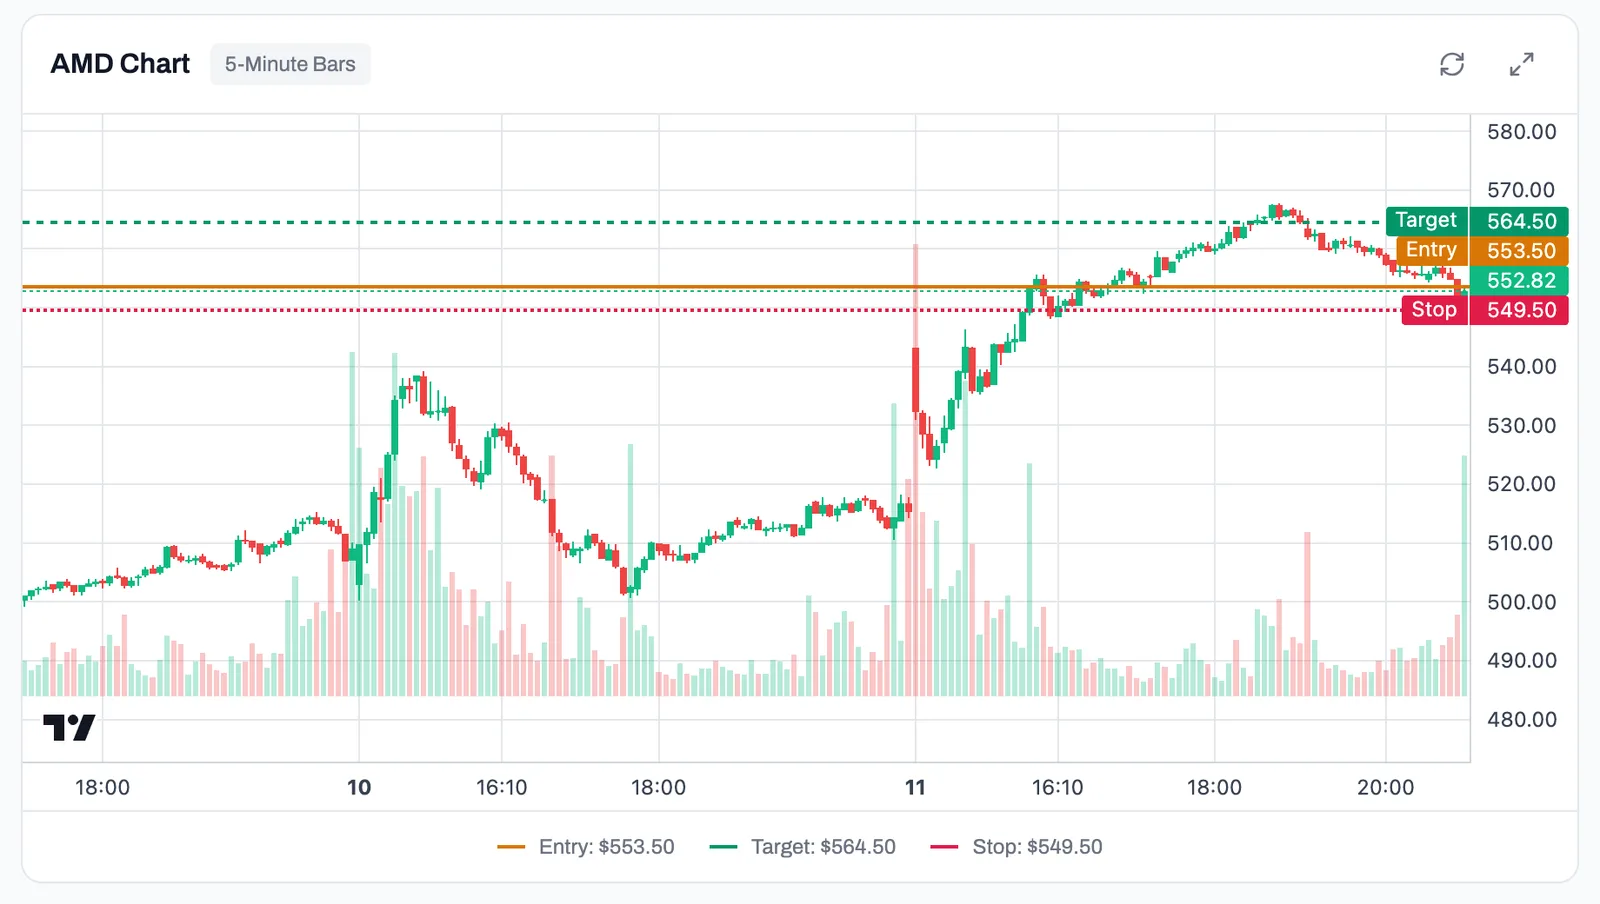
The entry at 553.50 filled in the 5-minute bar that opened at 12:05 PM ET. Price reached the 564.50 target in the bar that opened at 1:25 PM ET, about 80 minutes later, without touching the stop. The largest move against the position along the way was 0.17%.
What moves AMD
- Its own earnings and guidance, especially data-centre sales.
- News about AI chip demand and product launches, its own and its competitors'.
- Moves in the wider semiconductor group; AMD often trades in the same direction as Nvidia on sector news.
How day traders tend to approach it
- Percentage moves are often larger than the sector average, so risk per share needs to be set with that in mind.
- Traders compare it with NVDA and a semiconductor ETF to judge whether a move is company-specific or sector-wide.
- After large gaps, the first pullback to the opening range is a commonly watched entry area.
Run it on today's AMD chart
- Open the app and choose Symbol analysis.
- Type AMD and pick your timeframe (day trading uses 5-minute bars, as in this example).
- Read the setup, then check the entry condition, the stop and the "if it goes the other way" scenario before you do anything.
- Decide for yourself. The read is a second opinion with defined risk, not an instruction.
Free plan: 3 analyses a month. No credit card required. See also AI chart analysis, the AI trading analyzer and AI support and resistance.
Common questions
Is this AMD analysis current?
No. It is a dated example from November 11, 2026, replayed on historical bars. The levels on this page are not a trade idea for today. To get a read on the current AMD chart, run the analysis in the app.
How accurate is AI chart analysis on AMD?
Not accurate enough to follow blindly. This example reached its target, but it was chosen for that. In the replay run it came from (8 symbols over 20 trading days, 320 reads), 47 ideas reached their target and 126 hit their stop; the rest never filled or were still open at the close. Treat a read as a structured second opinion with a defined stop, and keep your own record of how the ones you act on turn out.
Can I run an AI analysis of AMD for free?
Yes. The free plan includes 3 analyses a month, and paid plans start at $8 a month. You type the symbol, pick a timeframe, and get the setup, entry, stop, target and key levels.