Replayed example · Oct 21, 2026, 10:00 AM ET · not current data
PLTR AI Chart Analysis: A Real Example, Level by Level
Palantir sells data-analytics software to government agencies and commercial customers. The stock has a large retail following and tends to be volatile.
Below is one real read of the PLTR chart by the DayTrade AI analysis engine: what it saw at 10:00 AM ET on October 21, 2026, the long setup it proposed, and what the price did afterwards.
The read: a long setup at 197.20
A conditional long setup is favored if PLTR breaks and holds above the recent 197.12 high, confirming the sharp volume-backed reversal from 192.58. The trade offers a 2:1 risk-reward profile with a stop below the developing 195.50 support zone and a same-day target near 200.20.
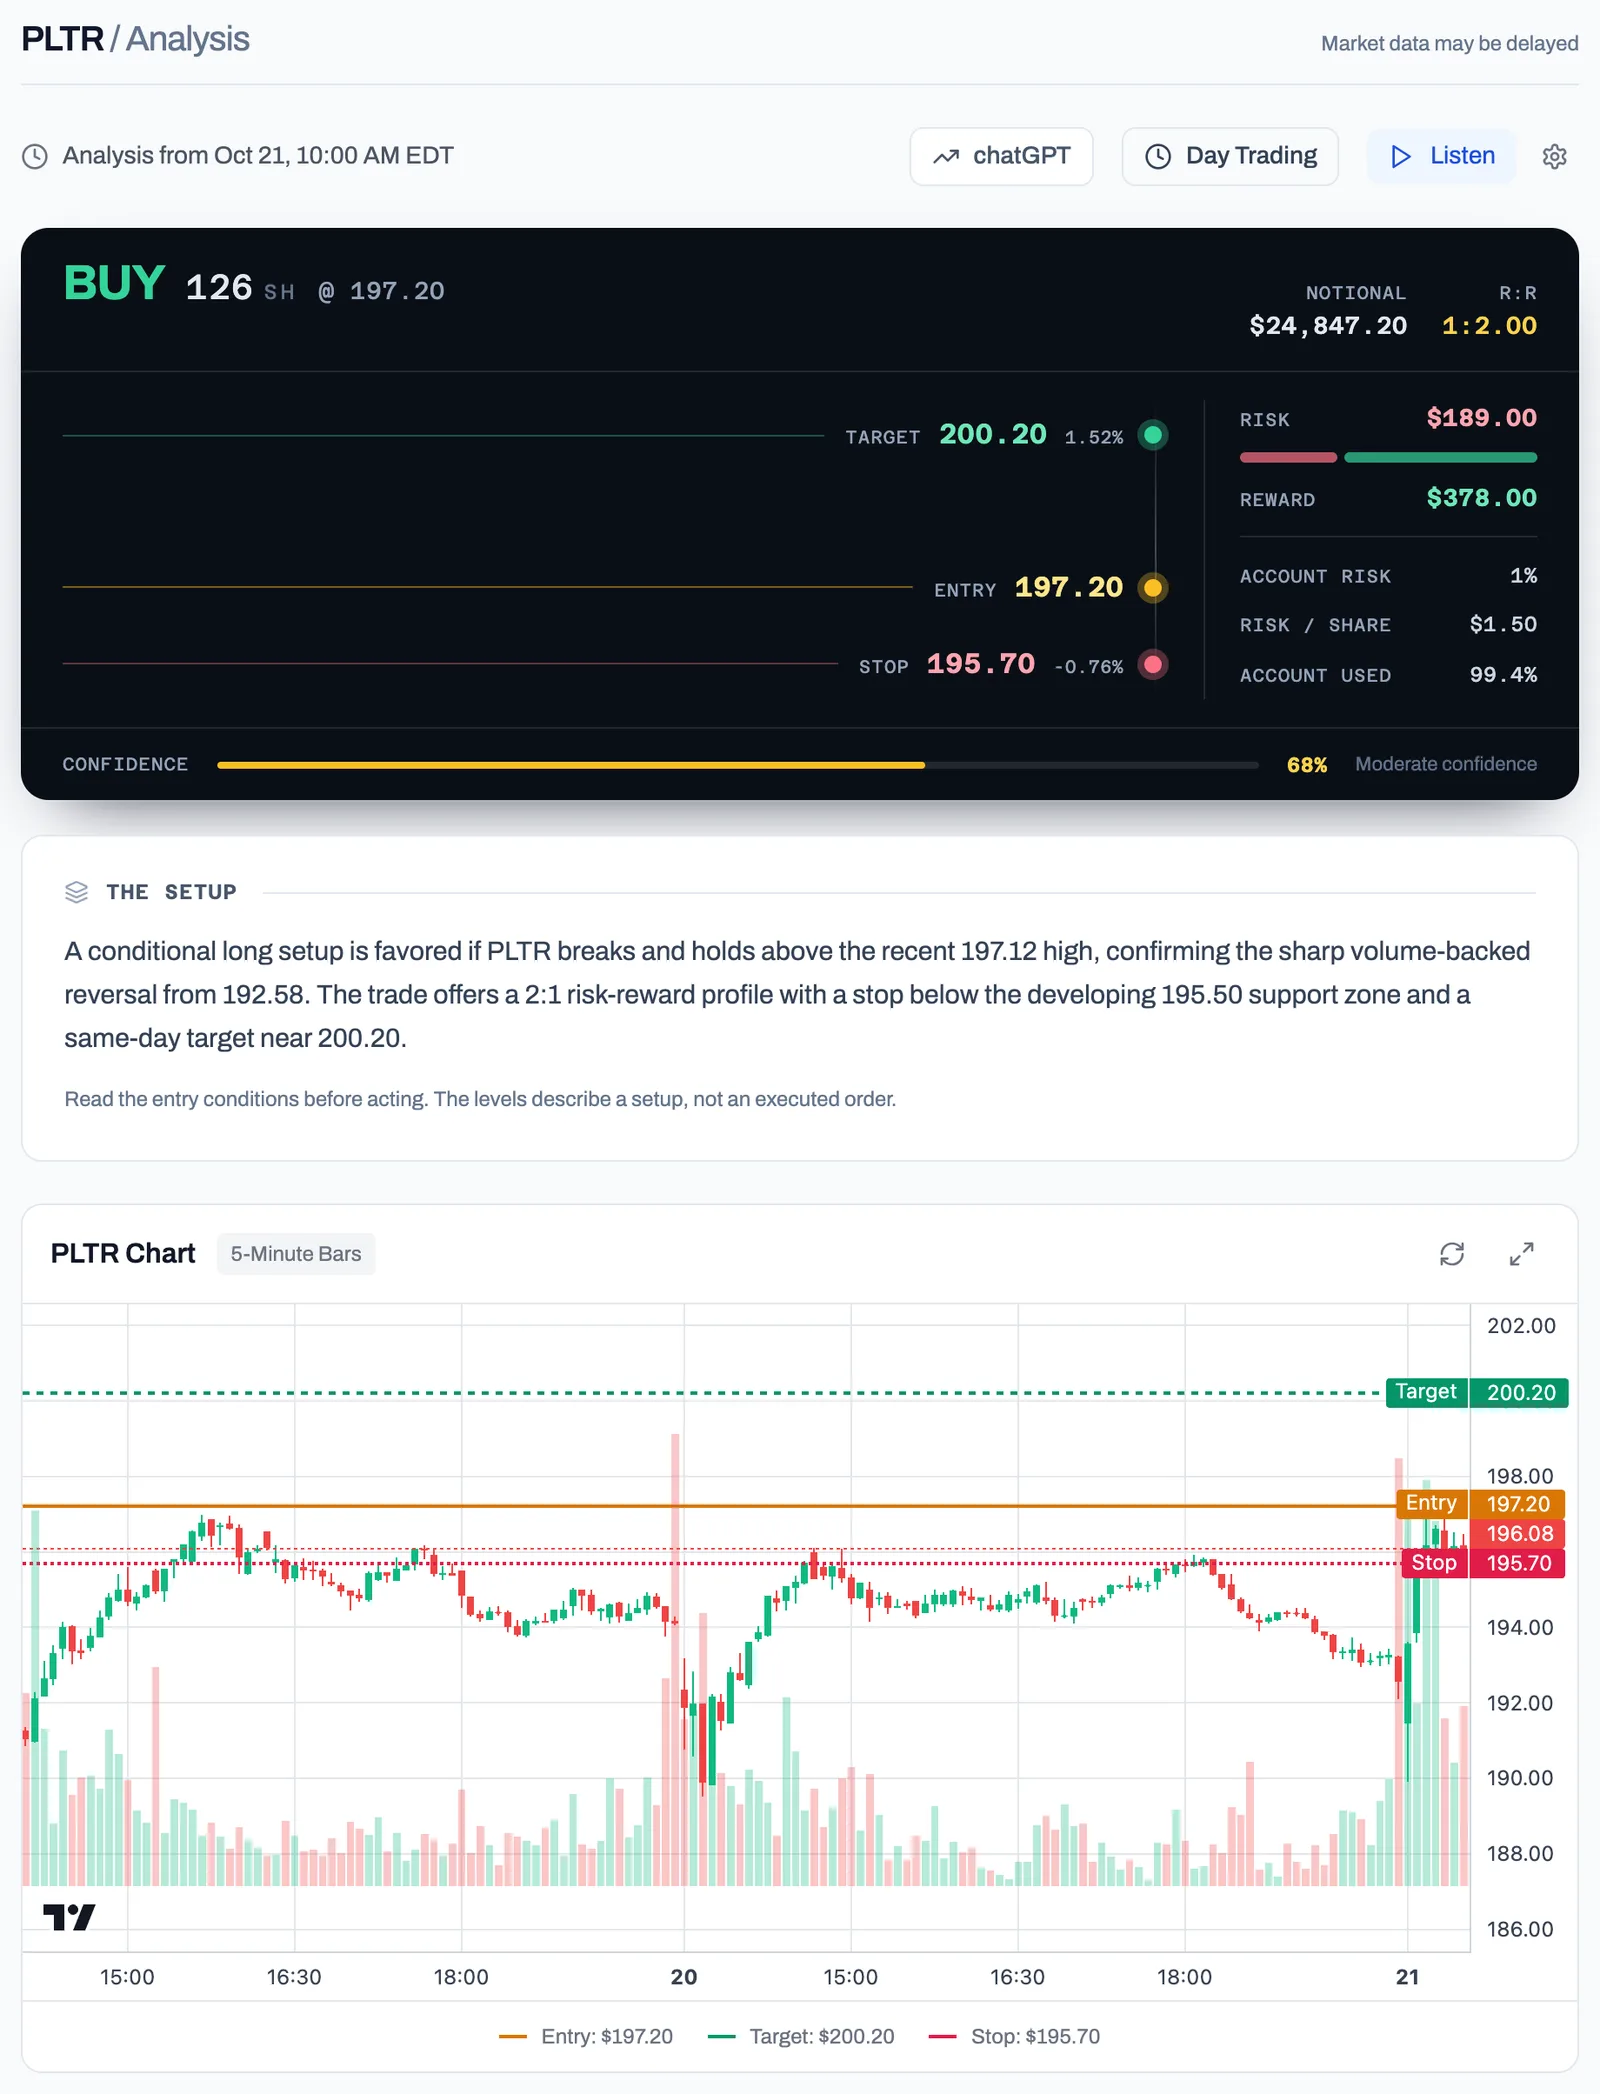
| Direction | Long (buy) |
|---|---|
| Entry | 197.20 |
| Stop | 195.70 (0.76% from entry) |
| Target | 200.20 (1.52% from entry) |
| Reward to risk | 2.00 to 1 |
| Model's stated confidence | 68% |
Why it proposed this
Price has reversed strongly from 192.58 with elevated volume and formed higher intraday lows into the 197.12 resistance area. A sustained breakout above 197.12 would signal short-term trend continuation, while failure to hold 195.70 invalidates the setup.
The five-day trend remains broadly weak, but the latest session shows a high-volume short-term reversal with elevated volatility. The setup is suitable only as an intraday breakout trade and should be closed before the market close.
Patterns and levels it named
Patterns: Bullish Reversal, Resistance Breakout, Higher-Low Formation, Trend Continuation.
Support
- 195.50moderate
- 193.20strong
- 192.58moderate
Resistance
- 197.12strong
- 198.50moderate
- 200.20moderate
What happened next
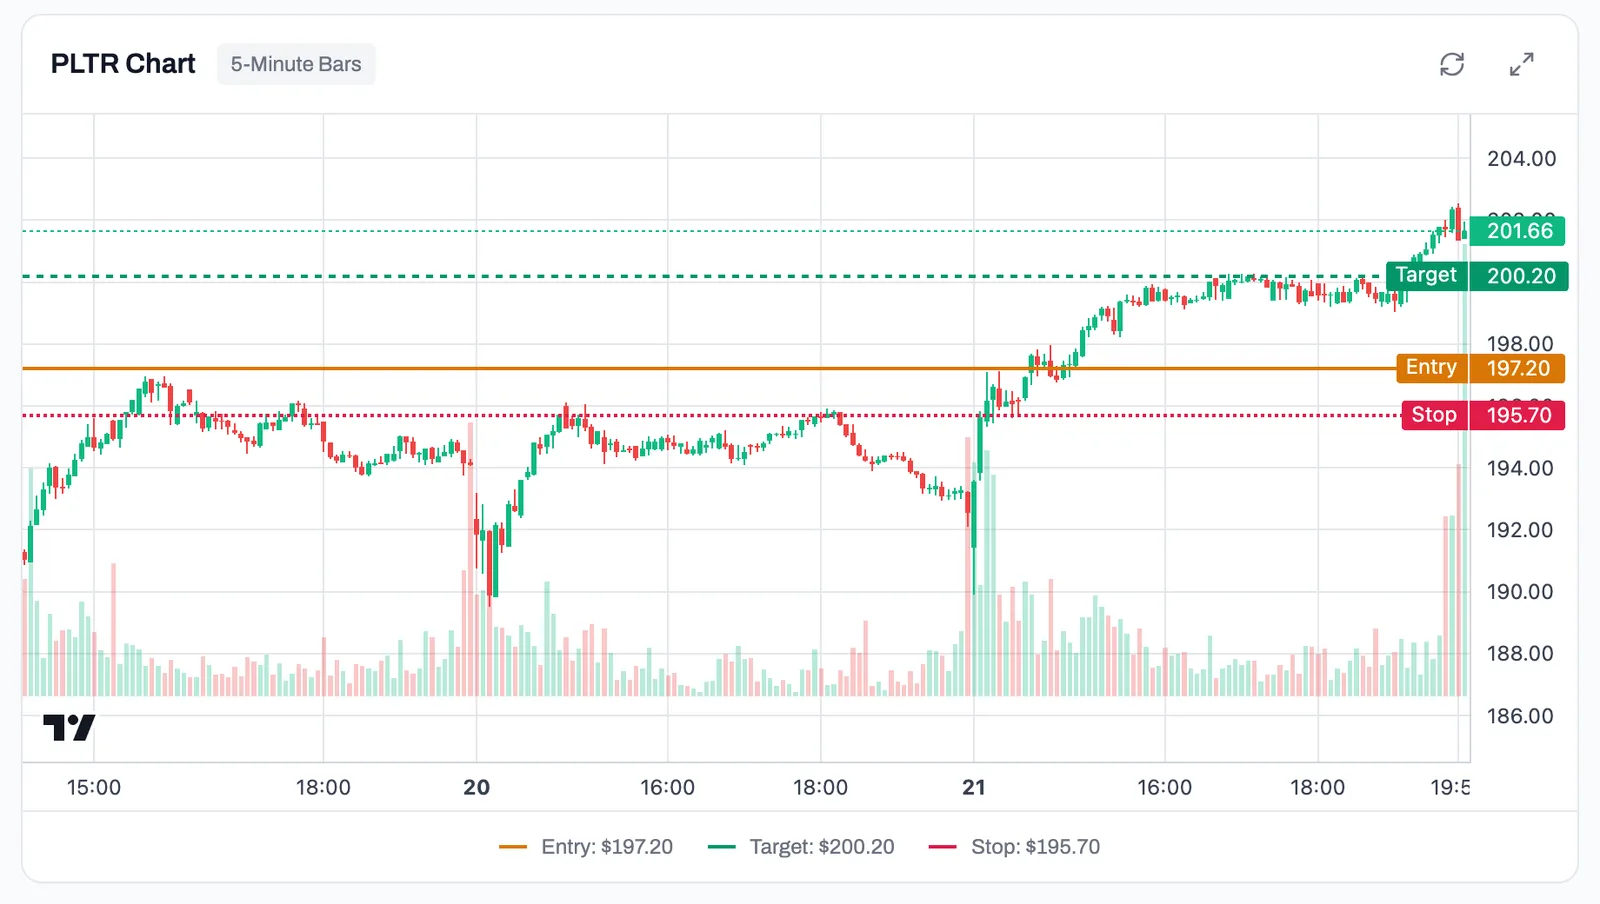
The entry at 197.20 filled in the 5-minute bar that opened at 10:15 AM ET. Price reached the 200.20 target in the bar that opened at 12:50 PM ET, about 155 minutes later, without touching the stop. The largest move against the position along the way was 0.25%.
What moves PLTR
- Contract announcements, particularly large government awards.
- Quarterly earnings, where commercial customer growth gets the most attention.
- General sentiment toward AI software companies.
How day traders tend to approach it
- Moves can extend further than the chart suggests when sentiment is strong, in either direction.
- Heavy retail participation makes round numbers and the prior day high and low widely watched.
- Volume around the open is high; later in the day it can thin out and make breakouts less reliable.
Run it on today's PLTR chart
- Open the app and choose Symbol analysis.
- Type PLTR and pick your timeframe (day trading uses 5-minute bars, as in this example).
- Read the setup, then check the entry condition, the stop and the "if it goes the other way" scenario before you do anything.
- Decide for yourself. The read is a second opinion with defined risk, not an instruction.
Free plan: 3 analyses a month. No credit card required. See also AI chart analysis, the AI trading analyzer and AI support and resistance.
Common questions
Is this PLTR analysis current?
No. It is a dated example from October 21, 2026, replayed on historical bars. The levels on this page are not a trade idea for today. To get a read on the current PLTR chart, run the analysis in the app.
How accurate is AI chart analysis on PLTR?
Not accurate enough to follow blindly. This example reached its target, but it was chosen for that. In the replay run it came from (8 symbols over 20 trading days, 320 reads), 47 ideas reached their target and 126 hit their stop; the rest never filled or were still open at the close. Treat a read as a structured second opinion with a defined stop, and keep your own record of how the ones you act on turn out.
Can I run an AI analysis of PLTR for free?
Yes. The free plan includes 3 analyses a month, and paid plans start at $8 a month. You type the symbol, pick a timeframe, and get the setup, entry, stop, target and key levels.