Replayed example · Oct 16, 2026, 10:00 AM ET · not current data
META AI Chart Analysis: A Real Example, Level by Level
Meta Platforms owns Facebook, Instagram and WhatsApp, and earns most of its revenue from advertising.
Below is one real read of the META chart by the DayTrade AI analysis engine: what it saw at 10:00 AM ET on October 16, 2026, the short setup it proposed, and what the price did afterwards.
The read: a short setup at 727.00
A bearish intraday continuation setup is developing after the sharp premarket rejection from $738 and successive lower highs into $727.74. A confirmed break below the $726-$727 area offers a short entry toward established support near $715.50, with favorable risk-reward and elevated downside volume.
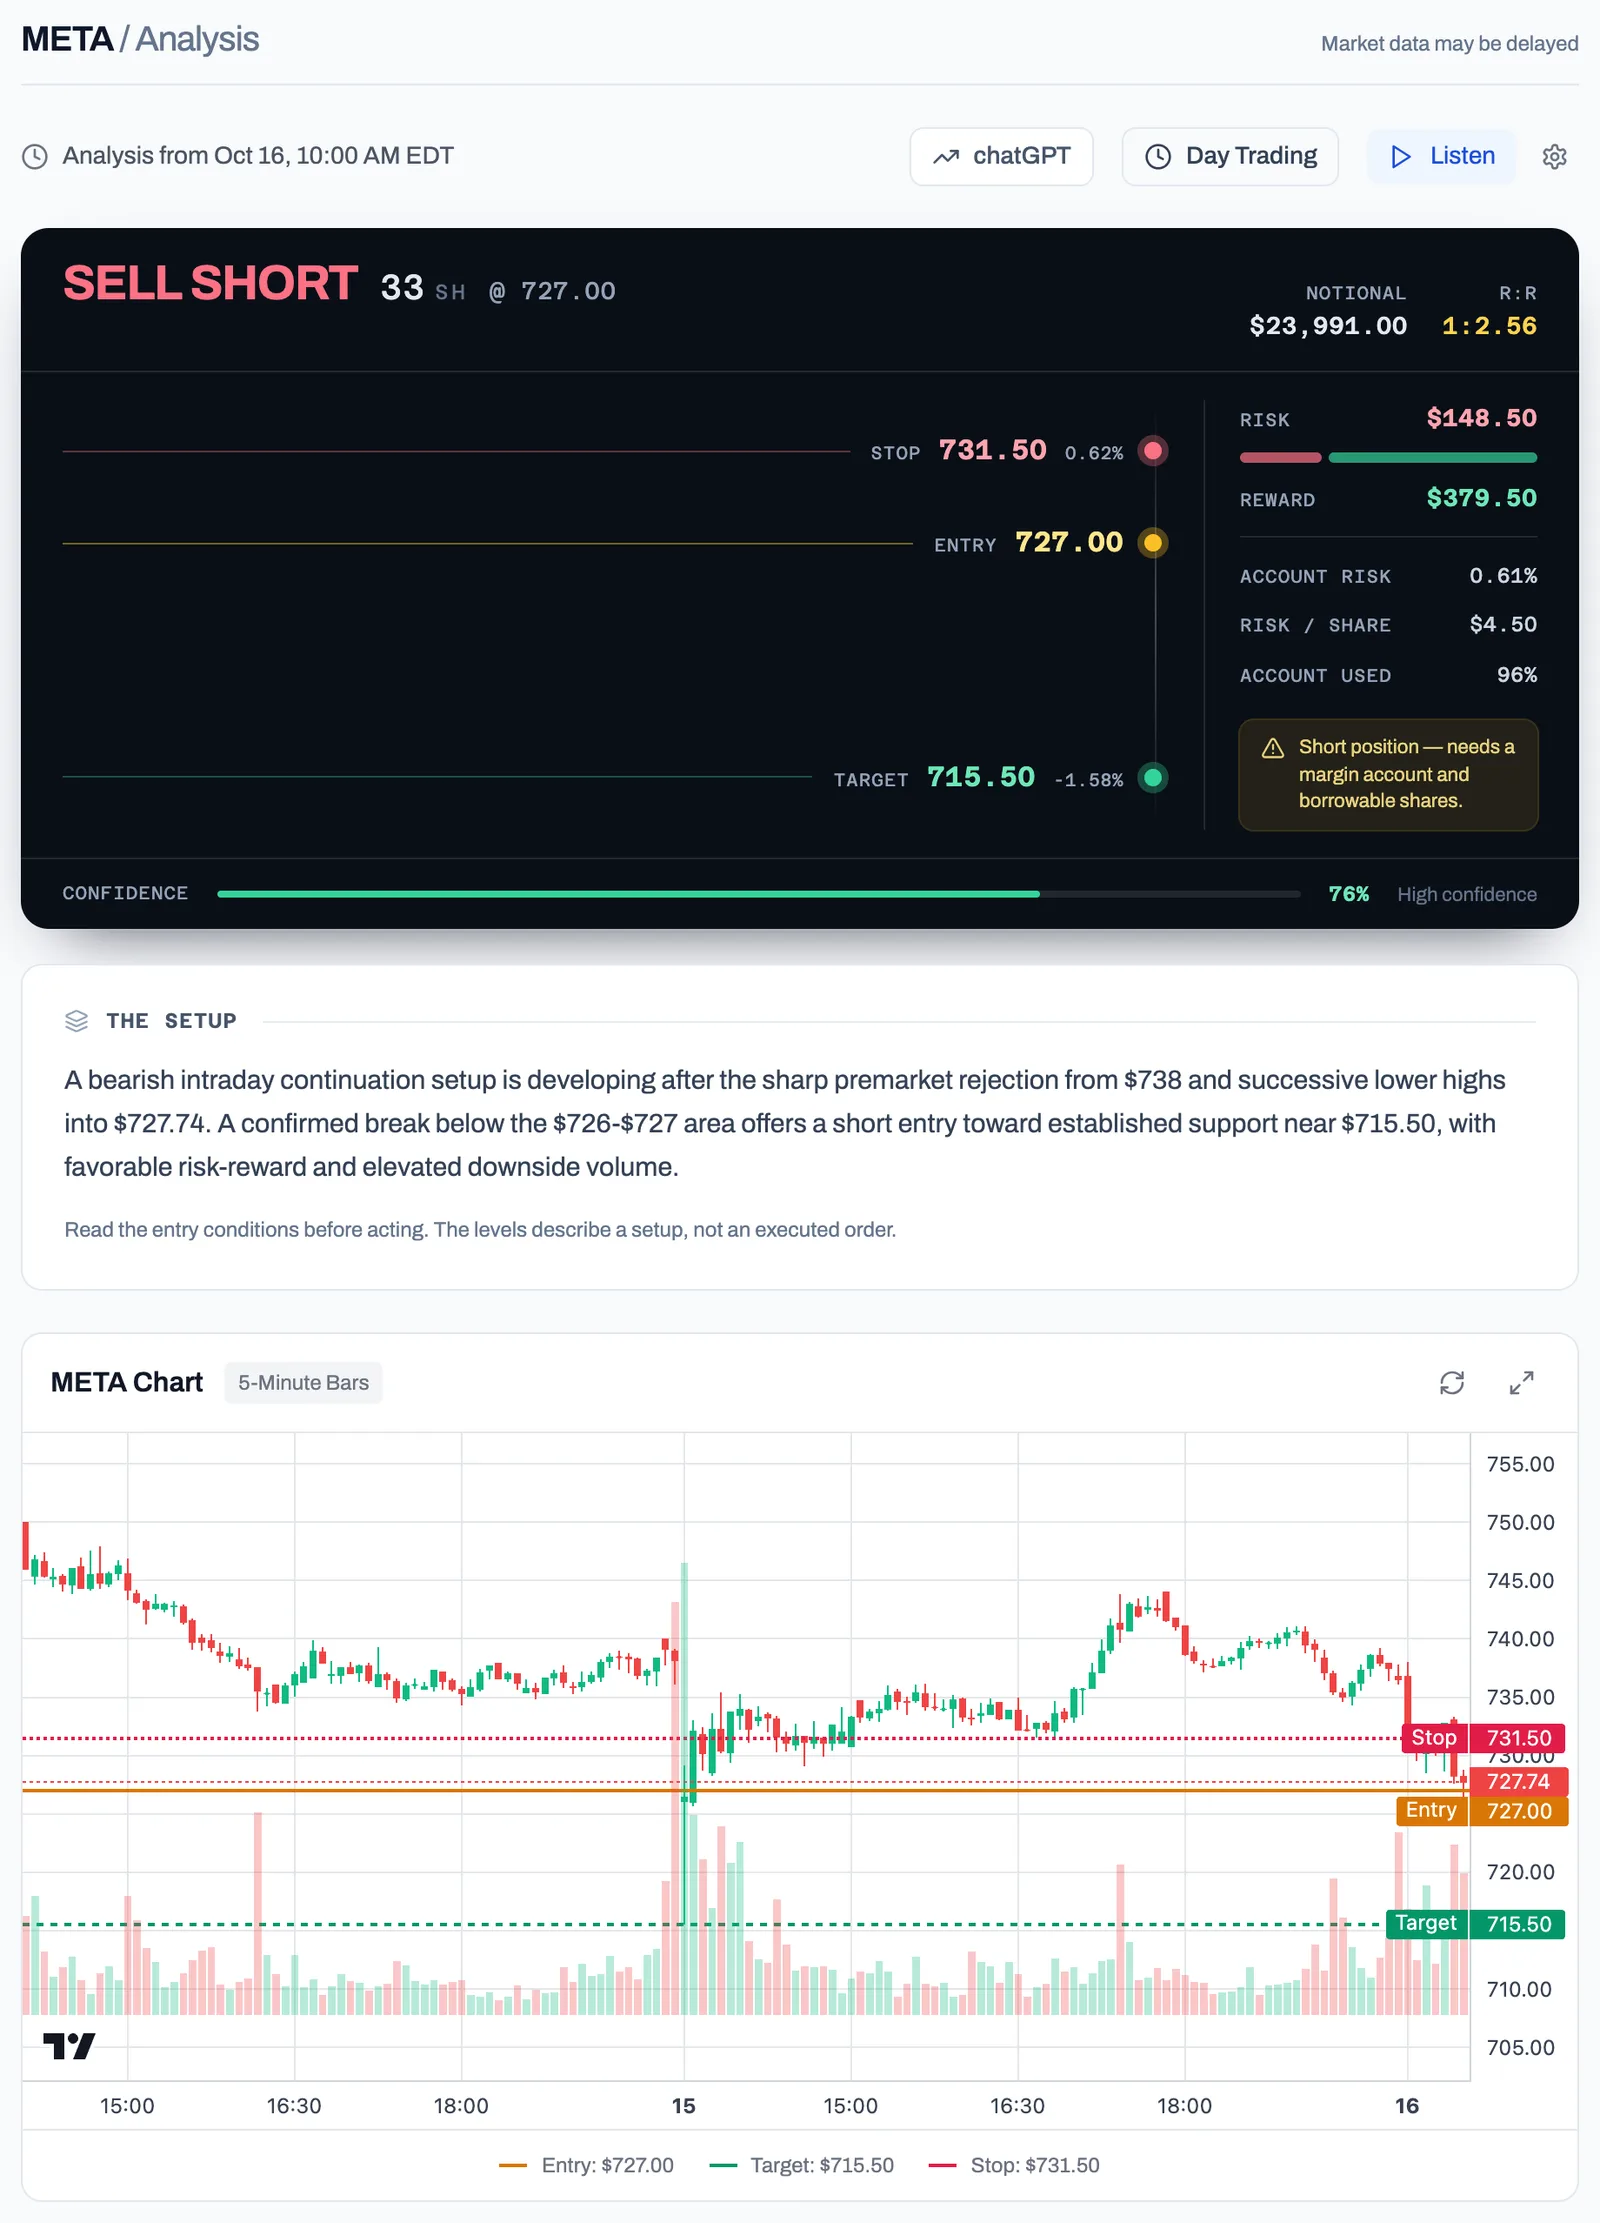
| Direction | Short (sell short) |
|---|---|
| Entry | 727.00 |
| Stop | 731.50 (0.62% from entry) |
| Target | 715.50 (1.58% from entry) |
| Reward to risk | 2.56 to 1 |
| Model's stated confidence | 76% |
Why it proposed this
Price has formed a lower-high/lower-low sequence, rejected the $737-$740 zone, and is pressing the $726-$727 breakdown area. Recent volume has expanded during declines, supporting bearish momentum. The trade risks $4.50 per share for an estimated $11.50 reward, producing a 2.56:1 risk-reward ratio.
Short-term intraday trend is bearish with elevated volatility following a premarket selloff. The broader five-day range is volatile and directionless, so the position should be closed before market close and should not be held overnight.
Patterns and levels it named
Patterns: Bearish Trend Continuation, Lower Highs and Lower Lows, Resistance Rejection, Bearish Flag Breakdown.
Support
- 726.10moderate
- 715.60strong
Resistance
- 731.50moderate
- 737.90strong
- 740.50moderate
What happened next
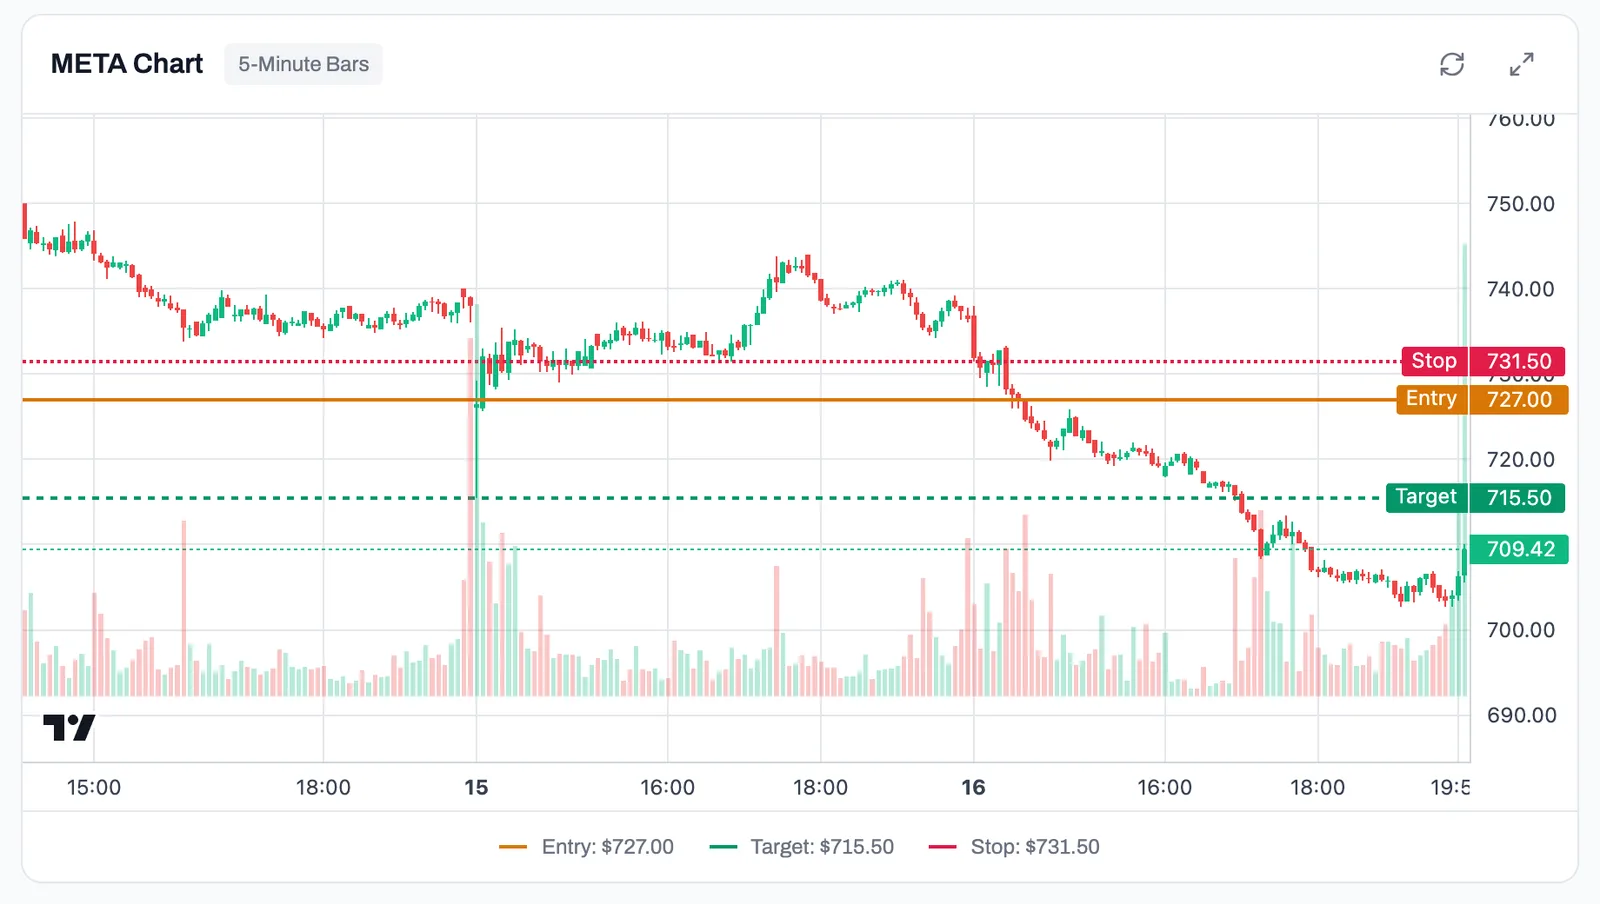
The entry at 727.00 filled in the 5-minute bar that opened at 10:05 AM ET. Price reached the 715.50 target in the bar that opened at 12:55 PM ET, about 170 minutes later, without touching the stop. The largest move against the position along the way was 0.13%.
What moves META
- Quarterly earnings, where advertising revenue and user figures matter most.
- Guidance on spending, particularly capital expenditure on AI infrastructure.
- Regulatory and legal decisions about privacy, competition and content.
How day traders tend to approach it
- The share price is high, so dollar moves look large; thinking in percentages keeps risk comparable with other stocks.
- Earnings reactions can set the tone for days, with the gap edges acting as reference levels.
- Outside of its own news it tends to track the large-cap technology group.
Run it on today's META chart
- Open the app and choose Symbol analysis.
- Type META and pick your timeframe (day trading uses 5-minute bars, as in this example).
- Read the setup, then check the entry condition, the stop and the "if it goes the other way" scenario before you do anything.
- Decide for yourself. The read is a second opinion with defined risk, not an instruction.
Free plan: 3 analyses a month. No credit card required. See also AI chart analysis, the AI trading analyzer and AI support and resistance.
Common questions
Is this META analysis current?
No. It is a dated example from October 16, 2026, replayed on historical bars. The levels on this page are not a trade idea for today. To get a read on the current META chart, run the analysis in the app.
How accurate is AI chart analysis on META?
Not accurate enough to follow blindly. This example reached its target, but it was chosen for that. In the replay run it came from (8 symbols over 20 trading days, 320 reads), 47 ideas reached their target and 126 hit their stop; the rest never filled or were still open at the close. Treat a read as a structured second opinion with a defined stop, and keep your own record of how the ones you act on turn out.
Can I run an AI analysis of META for free?
Yes. The free plan includes 3 analyses a month, and paid plans start at $8 a month. You type the symbol, pick a timeframe, and get the setup, entry, stop, target and key levels.